Welcome to Week 3 of the Social Media Spring Cleaning Challenge!
Last week we discussed ways to find out who is managing your social media accounts. We also shared ways to protect your agency’s accounts from everything from employee turnover to hackers. If you have been keeping up, you should now have a handle on where your agency is appearing on social media, know who is managing your presence, and have those pages connected to your social media archive.
In today’s Social Media Spring Cleaning challenge, we will identify which of your social media accounts are making waves and which are withering on the vine. We’ll use your archive to get a top level view of your overall activity, check out the network’s built-in analytics to drill down on reach and growth, and make sure that your pages are staying on brand.
Part 1 – Where’s the Party?
Now that you know what accounts you have as well as who is responsible for managing them, the next big question is how active are they.
Let’s start with the 10,000 foot view of your entire organization’s accounts. Using your Archivesocial archive, you can do a one-stop comparison of all the social media platforms being used by your agency.
Log in to your ArchiveSocial account and navigate to the “Reports” tab (admin level access required). Once there, click on the report titled, “Record Volumes & Plan Usage.” Below the summary table of your overall record volume you will find a list of all of your accounts along with their average monthly record volume. Clicking on the number in blue under “Monthly Record Volume” will give you a further breakdown of the past six months of data for that account. If you are curious, clicking the magnifying glass next to each entry in the expanded view will take you to the actual content for that month.
If you are using our Risk Management & Analytics package, you can do an even deeper dive into what content is getting a reaction on your pages using the “Social Media Activity Comparison” report. This further breaks down the volume on each of your pages by incoming versus outgoing content. It’s a great way to determine at a glance which accounts act as bulletin boards and which host more interactive conversations. We’ll talk more about what to do with that information in Part 4.
Part 2 – Is there anybody out there?
All of the social networks have built in tools that automatically track information on your posts, the trick is knowing how to find and use that information. Here is a breakdown of where to look on four of the most popular social networks:
Facebook:
Details on who saw your page, who liked and followed you, and how often people engage can be found by clicking on “Insights” on the top of your page view (note: you must be logged in as an admin to see this). By default, you will be shown the last seven days of data with the option to view 14 or 28 days.
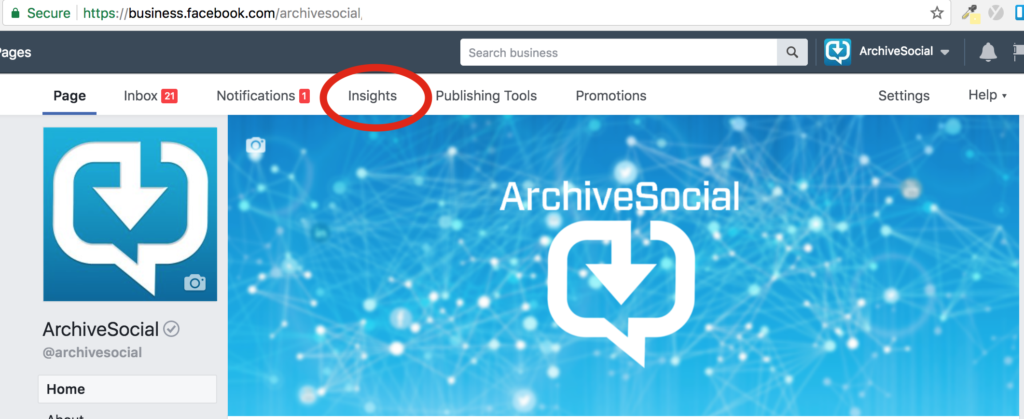
Where to find Insights on your Facebook page
Pro Tip: If you want to view more history, you can click on any of the individual charts and set a custom date range at the top. You can also toggle between charts using the menu on the left.
Twitter:
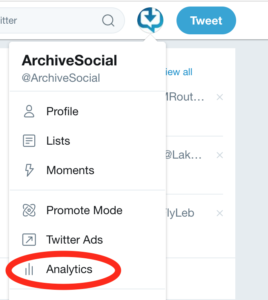
On Twitter, the details of your success can be found on a desktop by clicking your avatar in the upper right hand corner of the screen and then choosing “analytics” from the menu. Like Facebook, they display only 28 days of data by default, but you can get more by looking at each metric individually. For example, click on “Tweets” at the top of the analytics page and a drop down date selector appears on the right hand side next to the “Export Data” button.
Pro Tip: You can go back further than it appears! Choose the date furthest in the past on the drop down menu and then use the calendar to revisit data from years ago. The only caveat is that you can only view 90 days at a time, so it might take a while to pull the whole history.
Instagram:
Insights on Instagram are only available for business accounts. If you set your agency’s profile up as a personal account, don’t despair. You can easily turn that personal account into a business profile by following the steps here. Once that is done, simply click on the little insights icon (it looks like a bar graph) in the top right corner of your mobile app. There are two caveats to Instagram Insights: you can only view them on mobile, and you can’t currently export the data.
Pro Tip: Did you know you can add up to five Instagram accounts to your mobile app so you can switch between them without logging in and out? Simply go to your settings and scroll all the way down until you see “Add Account”.
YouTube:
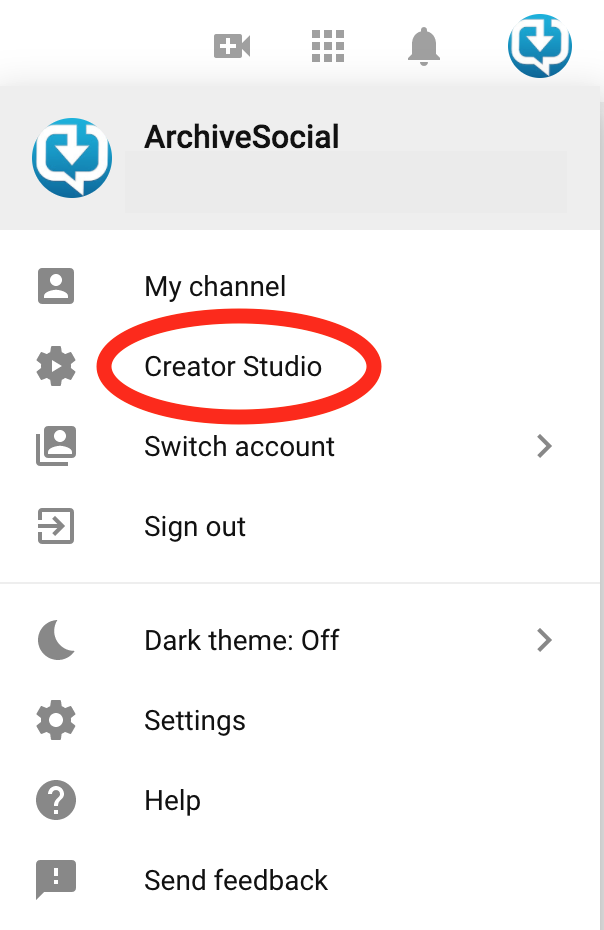
YouTube menu where you can find Creator Studio
YouTube’s many menus and views make it tricky to track down your data, but the secret to uncovering your analytics lies in the Creator Studio. From your YouTube home screen, click on your avatar in the upper right corner and select “Creator Studio” from the menu. Once you are there, choose “Analytics” from the menu on the left and prepare yourself for all the data you could ever ask for. Once you narrow down what sort of information you want to see (watchtime, audience demographics, subscribers, etc.) you can use the dropdown in the upper right to refine your timescale to whatever range you can imagine and then export your data to boot.
Pro Tip: It is easy to become overwhelmed by the sheer volume of data YouTube makes available. Take some time to decide what matters to you before digging in. Your top ten videos are automatically listed on the analytics home screen, so you might just want to start there.
Part 3: What does it all mean?
Now that you know what accounts you have and how engaged they are, the next question is: are you using them appropriately? Each social media network is best suited for different types of content. Maximizing these differences and being strategic with what is posted where helps maximize engagement (unless the networks play with the algorithms ;)).
The internet is full of articles on developing content strategy for different networks, so we won’t go too in depth on that here. Instead, let’s just focus on a high level view of how to consider your network choices.
One way to decide what to post where is to think about each network in terms of how users typically interact with it. While every network can fit into each of these categories, each can be classified by its primary use case.
- Networks primarily used for conversation/discussion (Facebook)
- Networks used for quick information (Twitter)
- Networks used for entertainment/promotion (YouTube, Instagram)
Twitter – Twitter is best for quick-blast updates. This is most helpful during an emergency situation, Twitter is your most effective tool for getting crucial information out fast. It’s also where many constituents choose to send quick messages to agencies regarding discreet problems such as potholes and to ask in-the-moment questions.
Instagram – Best for promoting events, tourism, or anything else that has a high visual component. Instagram is also very popular with the under 25 set, so if compliance risks are keeping you off of Snapchat, than Instagram might be a good alternative.
Facebook – Facebook is great for longer posts, creating conversations and live video. Want to livestream your town council or school board meeting and generate questions? Facebook is a great place. It is also a place where constituents may choose to send private messages as well.
Youtube/Vimeo – Long form video content such as city council meetings, educational videos, and tourism promos are great choices for YouTube. This content can then be easily embedded in other channels or on your website. Of course, you can go the other way and broadcast using Facebook Live or Periscope and then download those videos and post to YouTube later.
If you have it, take a fresh look at the “Social Media Activity Comparison” report we discussed in part one. Do the inbound/outbound percentages align with expectations based on the network type? (If you don’t have this report, you can search each account individually and compare posts v. comments or tweets v. mentions to get a very rough idea).
A few questions you may ask yourself include:
- Is your Facebook page all outbound content with no comments back? You might not be posting content that invites conversation. Try experimenting with your tone or even openly soliciting feedback in your top level post.
- Is your Twitter feed filled with mentions, but your agency hardly ever tweets? Your constituents might be hungry for information that you aren’t providing. There may be opportunities for you to improve your customer service (i.e. citizen satisfaction) that you are missing.
- Are your YouTube views falling off after a few minutes or so? Try tailoring your content to match your audience’s viewing habits so your message doesn’t get lost.
These are just a few ways the insights you have gained today can help with your content strategy. We’d love it if you would share some of your own aha moments.
Part 4: Put on your best face
There is one last area of content strategy that can be easily overlooked, especially for agencies with a large social media footprint: branding.
Your final Social Media Spring Cleaning task this week is to scroll through the profiles images, banners, logos, and “about” pages for all of your accounts to make sure there is a consistent brand image being presented to the public.
Why does this matter? In this era of distrust for online sources, you want to be sure that your audience sees your agency as a consistent, reliable source. This starts with your visual presentation, extends through your content, and finishes with your records. Now more than ever you need to make sure that when people find you online, they find the trust indicators that make them feel confident that it really is you.
If you don’t have them already, talk to your communication team about creating written guidelines that every department cab refer to when creating accounts. Include current logos, color schemes, naming conventions, and anything else that makes your agency distinct. Set a review schedule to ensure continued compliance.
Next week: Policy Refresh
Social media is a constantly changing animal and your policy needs to change with it. Next week in the final installment of our Social Media Spring Cleaning challenge we will share our latest policy updates pulled from the pages of some of the most forward thinking agencies in the country. We’ll tell you what is out, what is in, and what is on the horizon.
See you next week!